Axel Gasulla is a researcher in the areas of new media technology and data languages. Co-founder and research director of Domestic Data Streamers, he leads applied social research projects in the field of communication, innovation and organizational development. In dialogue with Olivier Schulbaum of Platoniq, we talk about his project and how data is essential, but alone is not enough. In this interview we will see how any meaningful exchange of information between people needs to involve emotions and experiences to create knowledge or change.
O.- I think you and I agree in seeing data as language. Data, like language, is a descriptive system. It helps us organize and understand the world. And, like language, it should offer us possibilities, invite curiosity, facilitate understanding. How do you think data and the work of Domestic data Streamers (DDS) help us to organize and understand the world? How do we move from a descriptive language of data to a discourse that invites us to dialogue?
A.- Data tells things that have been counted numerically. A database is a count that can be how many tables there are in a house, how many kilometers you have traveled… and there is not much discussion about that. Empathy begins when we visualize that count and ask ourselves why it has been counted.
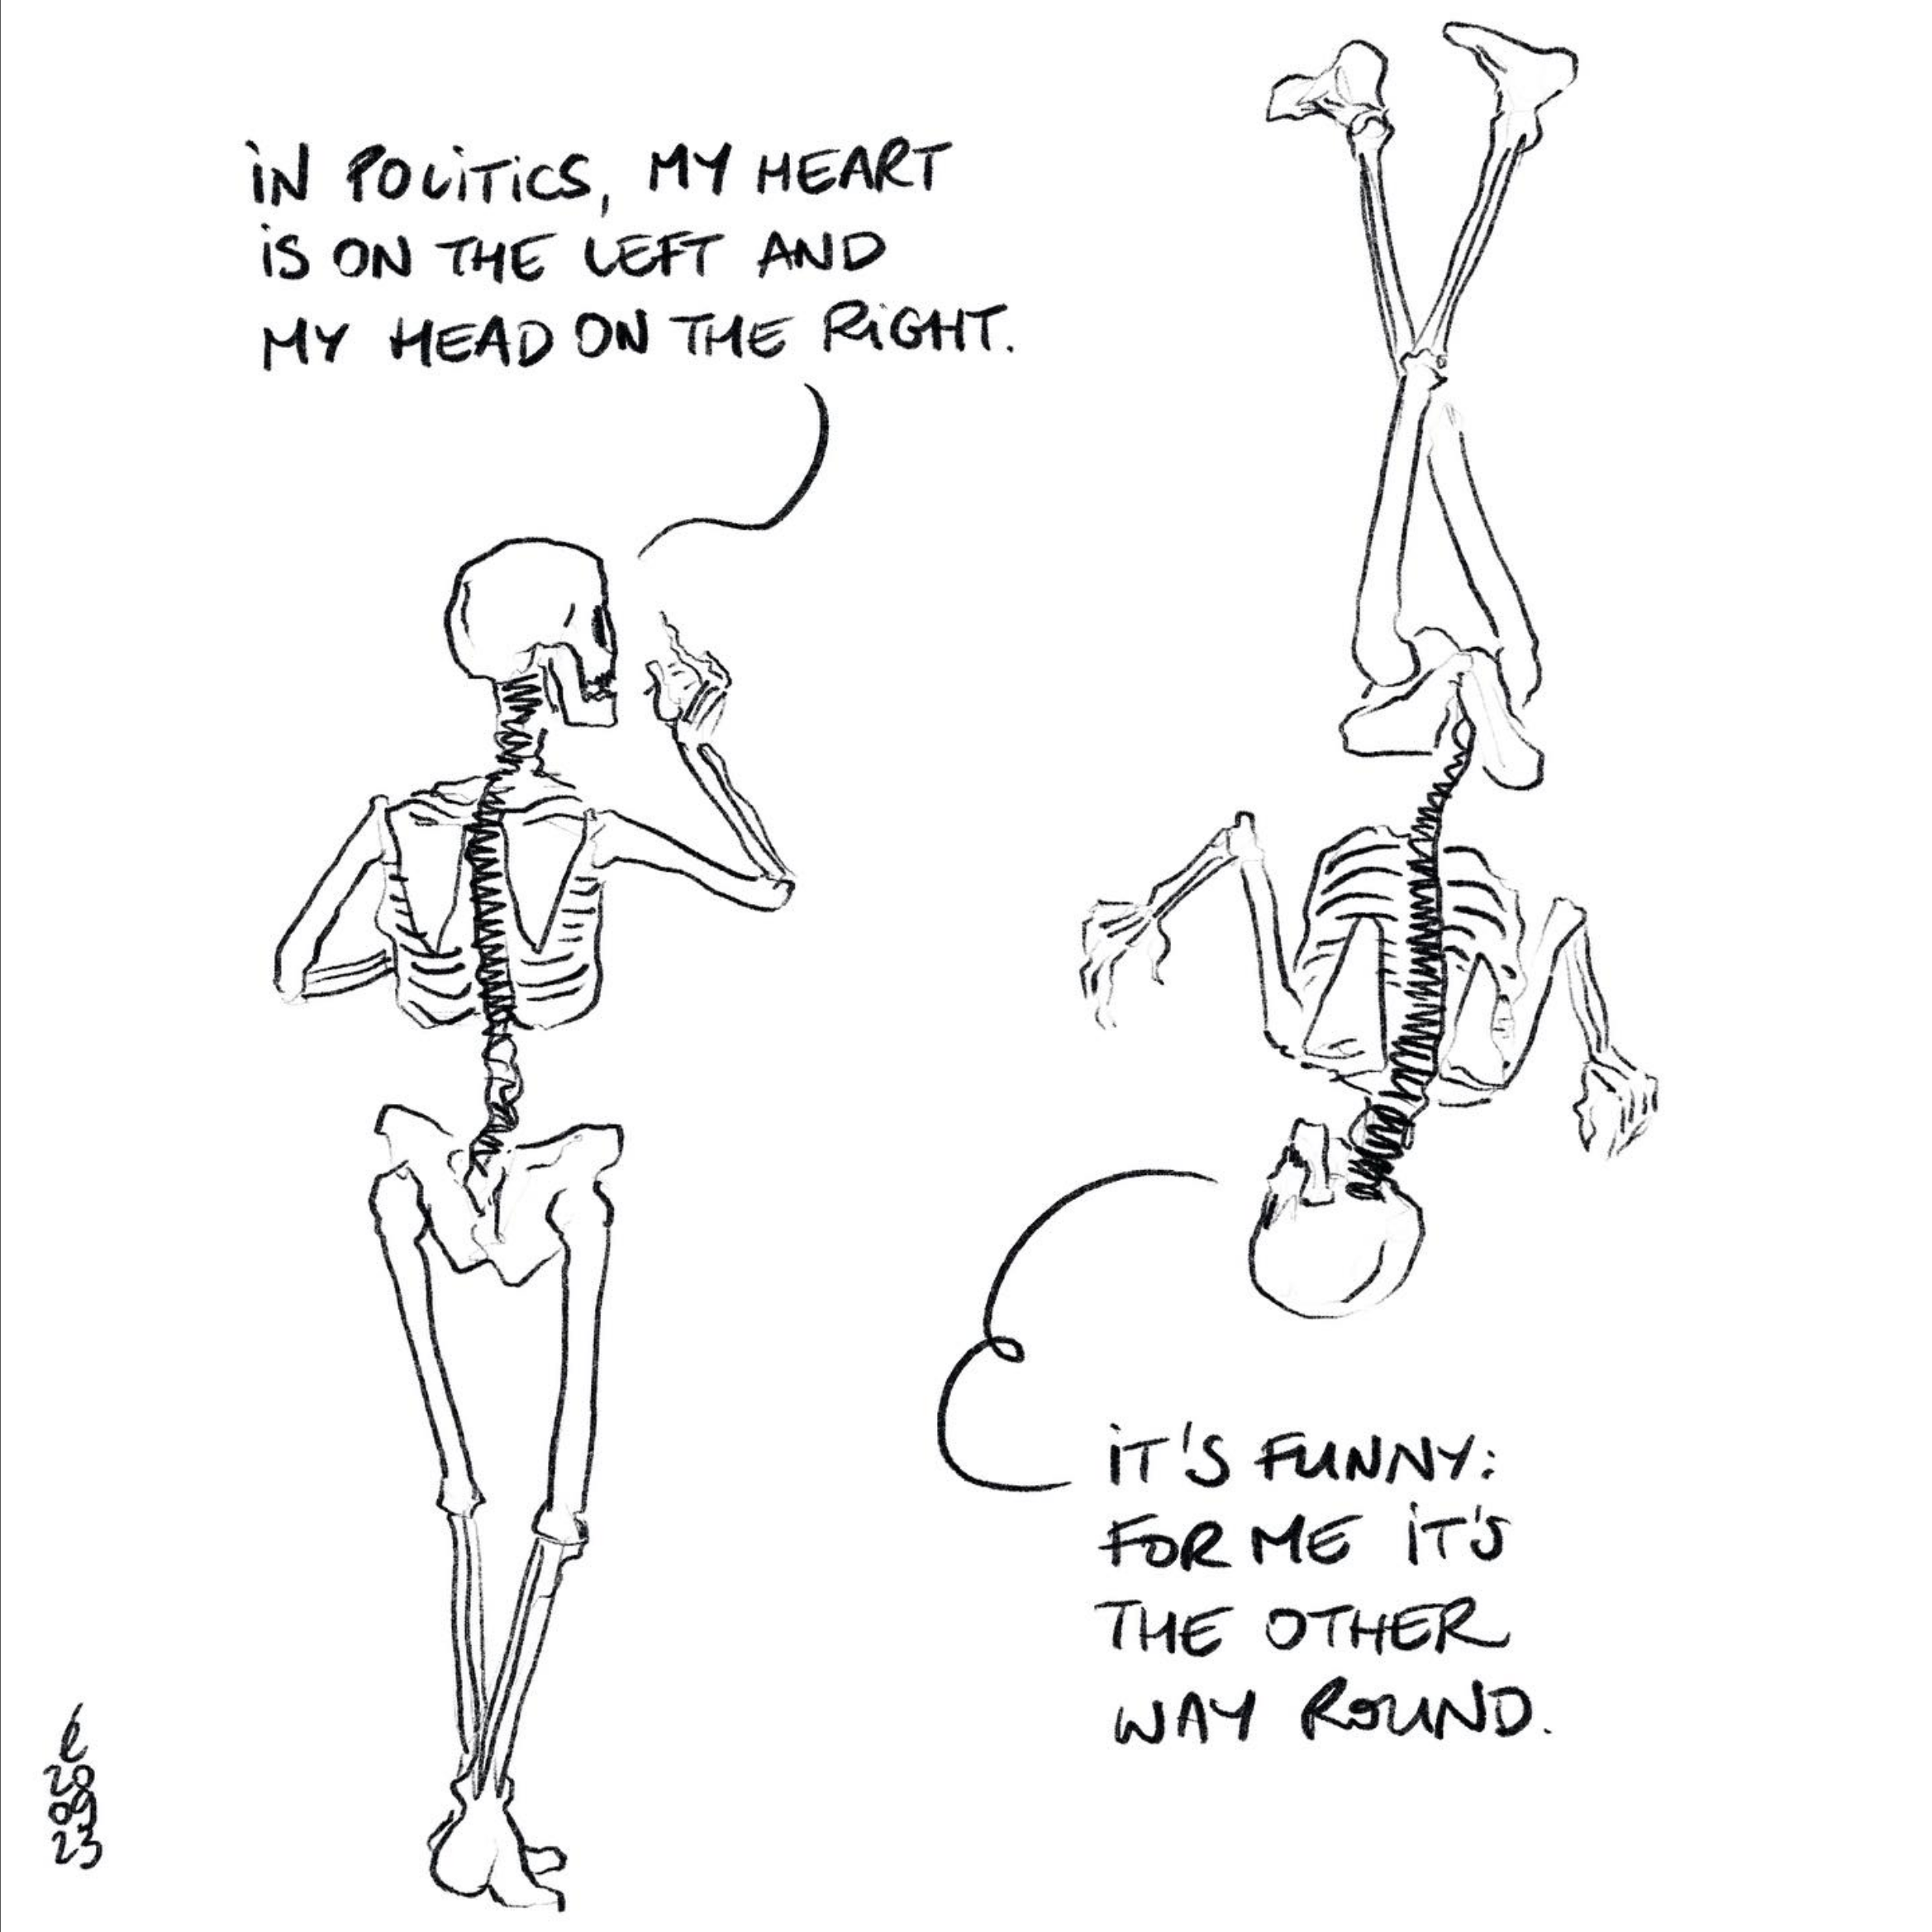
The data touches us all equally, but the "why" is where there is a story. That's where we can get a person to turn the story around and move "from one hemisphere to the other" through a story
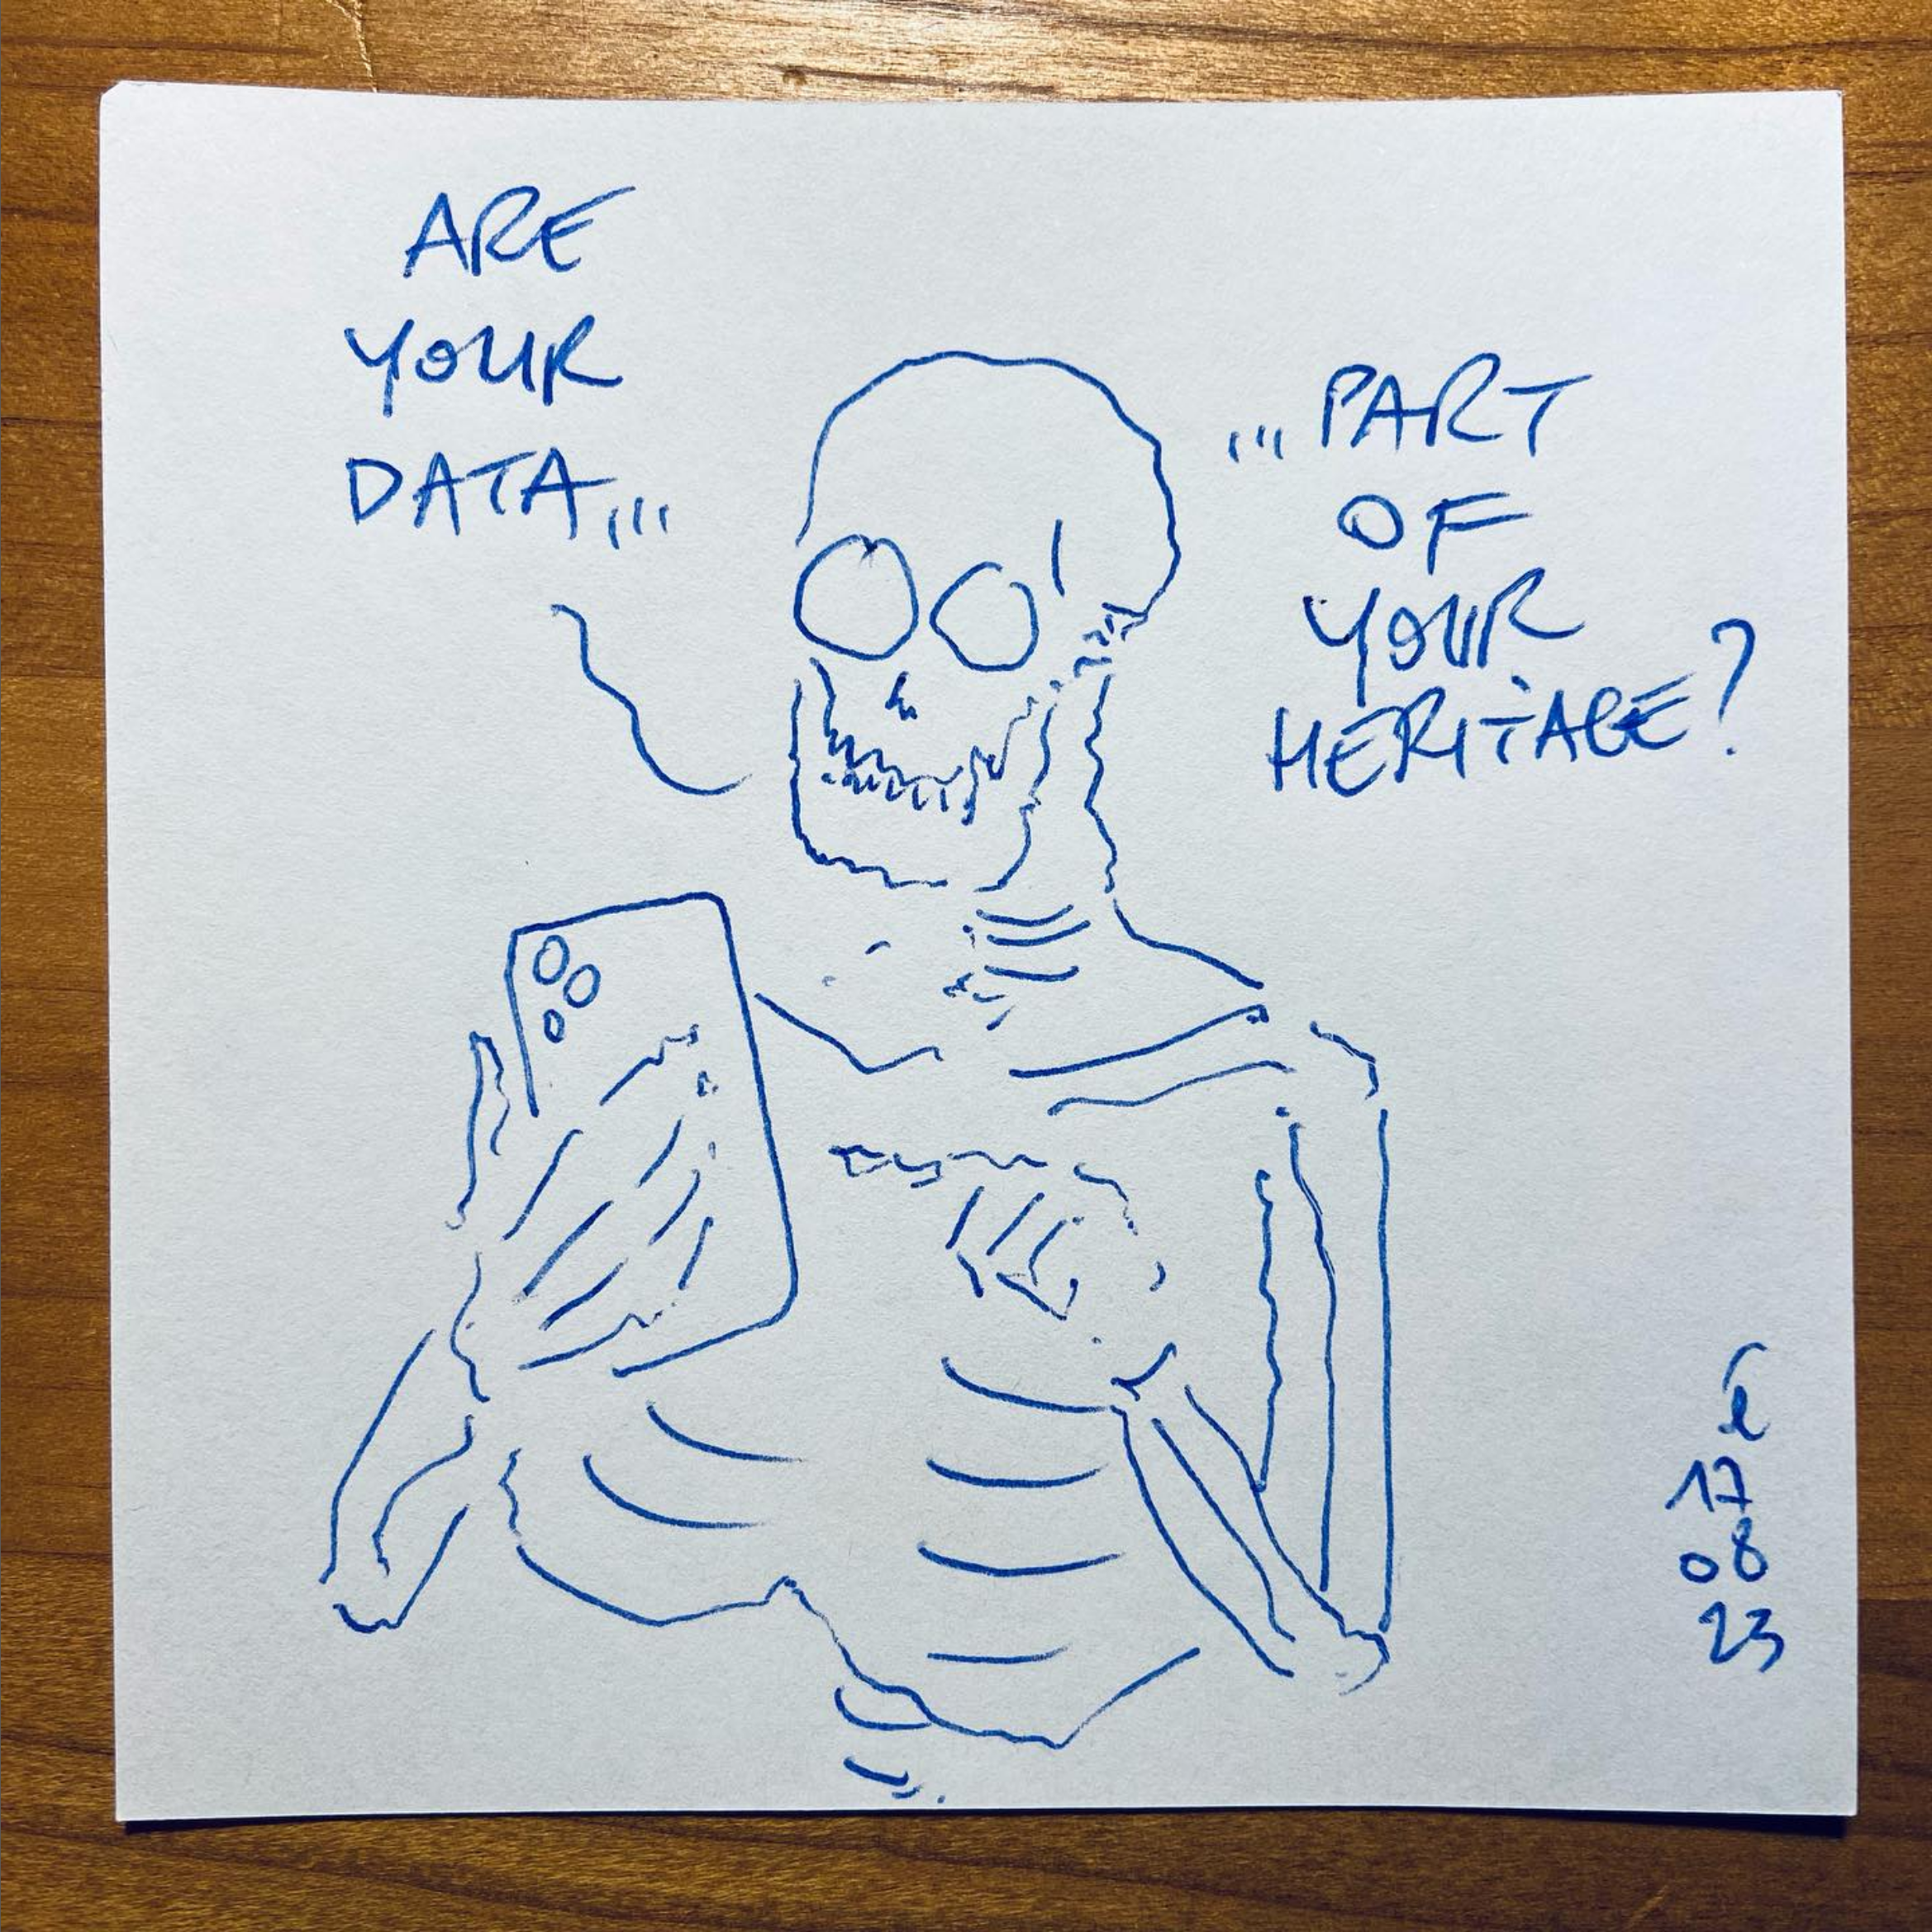
Why is it important for you or for me? Everyone can spend the whole day counting how much money they have in their bank account, one day we compare it and start talking about it: “hey, but why is it important for you; what did you have to do to get here; what did I have to do to get here? Maybe someone says, “no, look, to get to have a thousand euros in my account, I have worked under slave and precarious conditions where they have not given me social security, dedicating the time of my life to all this”. And someone says, “ah, to have a thousand euros in my account, I only had to ask my parents for them”. The fact of those thousand euros is relevant because it can open up this space for dialogue. And I think that’s the point: the data touches us all equally, but the “why” is where there is a story. That’s where we can get a person to turn the story and move “from one hemisphere to the other” through a story, as well as make it so that whoever is on the other side can come to the other side. We are interested in that great potential of creating dialogues between different groups of human beings whose tendency is to isolate themselves from each other, overcoming the stories that separate us.
O.- Before we continue opening the melon of data, I have a curiosity that I think will be shared about your name. What is the meaning of Domestic and what is its function with Data Streamers?
A.- You see, the initial idea was to give a closer, more human and warm vision to an activity that is usually quite cold, such as data communication. To look for that parallelism with a familiar, intimate environment would help us to create much more complete information experiences.

O.- Interesting, is there any specific strategy you have in place to ensure that this space is recognized as your own and at the same time shared?
A.- Well, there are certain elements that generate a link between the message to be transmitted and the concepts that you can understand because they are close to your usual knowledge space. When generating an experience whether in the exhibition, digital or public framework, we ask questions and include elements of participation or co-creation. It can be an artistic representation in which the aesthetics itself is already generating an attraction or a cognitive tension that helps you to understand information in more depth.
That already invites the visitor to feel that space a little more fluid because he/she is understanding in more depth the context in which at the beginning he/she perceives him/herself as a strange agent in that environment.
This is where we understand that a story is being written between the context, the space, the objects and each of the visitors. By leaving their mark on this space, by saying what they think or leaving it in writing, they turn it into a space that is cared for, explained and in which collective information is generated
That is where we understand that a story is written between the context, the space, the objects and each of the visitors. By leaving a mark in that space, by saying what they think or leaving it in writing, they turn it into a space that is cared for, explained and in which collective information is generated. That is our vision when we intervene in the space.
O.- Could I then break into your house right now and start painting graffiti over the works or drawings you may have or the visualizations that represent your world and thus intervene them? That would be an experimental way to check if that is so.
A.- Yes, it would be an experimental test to see if the idea we have of creating a space where visitors can leave their mark is viable. In this example, I imagine we could have a space for graffiti and another for poetry.
A rather interesting phenomenon is that of "legacy": when in an exhibition we treat the visitor with respect and as an intelligent agent, when the moment of interaction arrives, the visitor lives up to that treatment in his actions
O.- In terms of graffiti culture you are as aware that you leave a trace as you are that this trace can be erased by others. So sometimes there is a struggle between visitors, between different artists, where some cover the traces of others. Have you noticed similar tensions between visitors in your actions?
A.- In open exhibition spaces you find everything. An interesting phenomenon is that of “legacy”: when in an exhibition we treat the visitor with respect and as an intelligent agent, when the moment of interaction arrives, the visitor lives up to this treatment in his or her actions. Society only behaves childishly when you treat it as such. In social networks the interaction is different because it is anonymous, but when you are in a physical and closed space, people behave in a more civic way. There are always exceptions, but in general people respond positively and leave their mark in a constructive way.
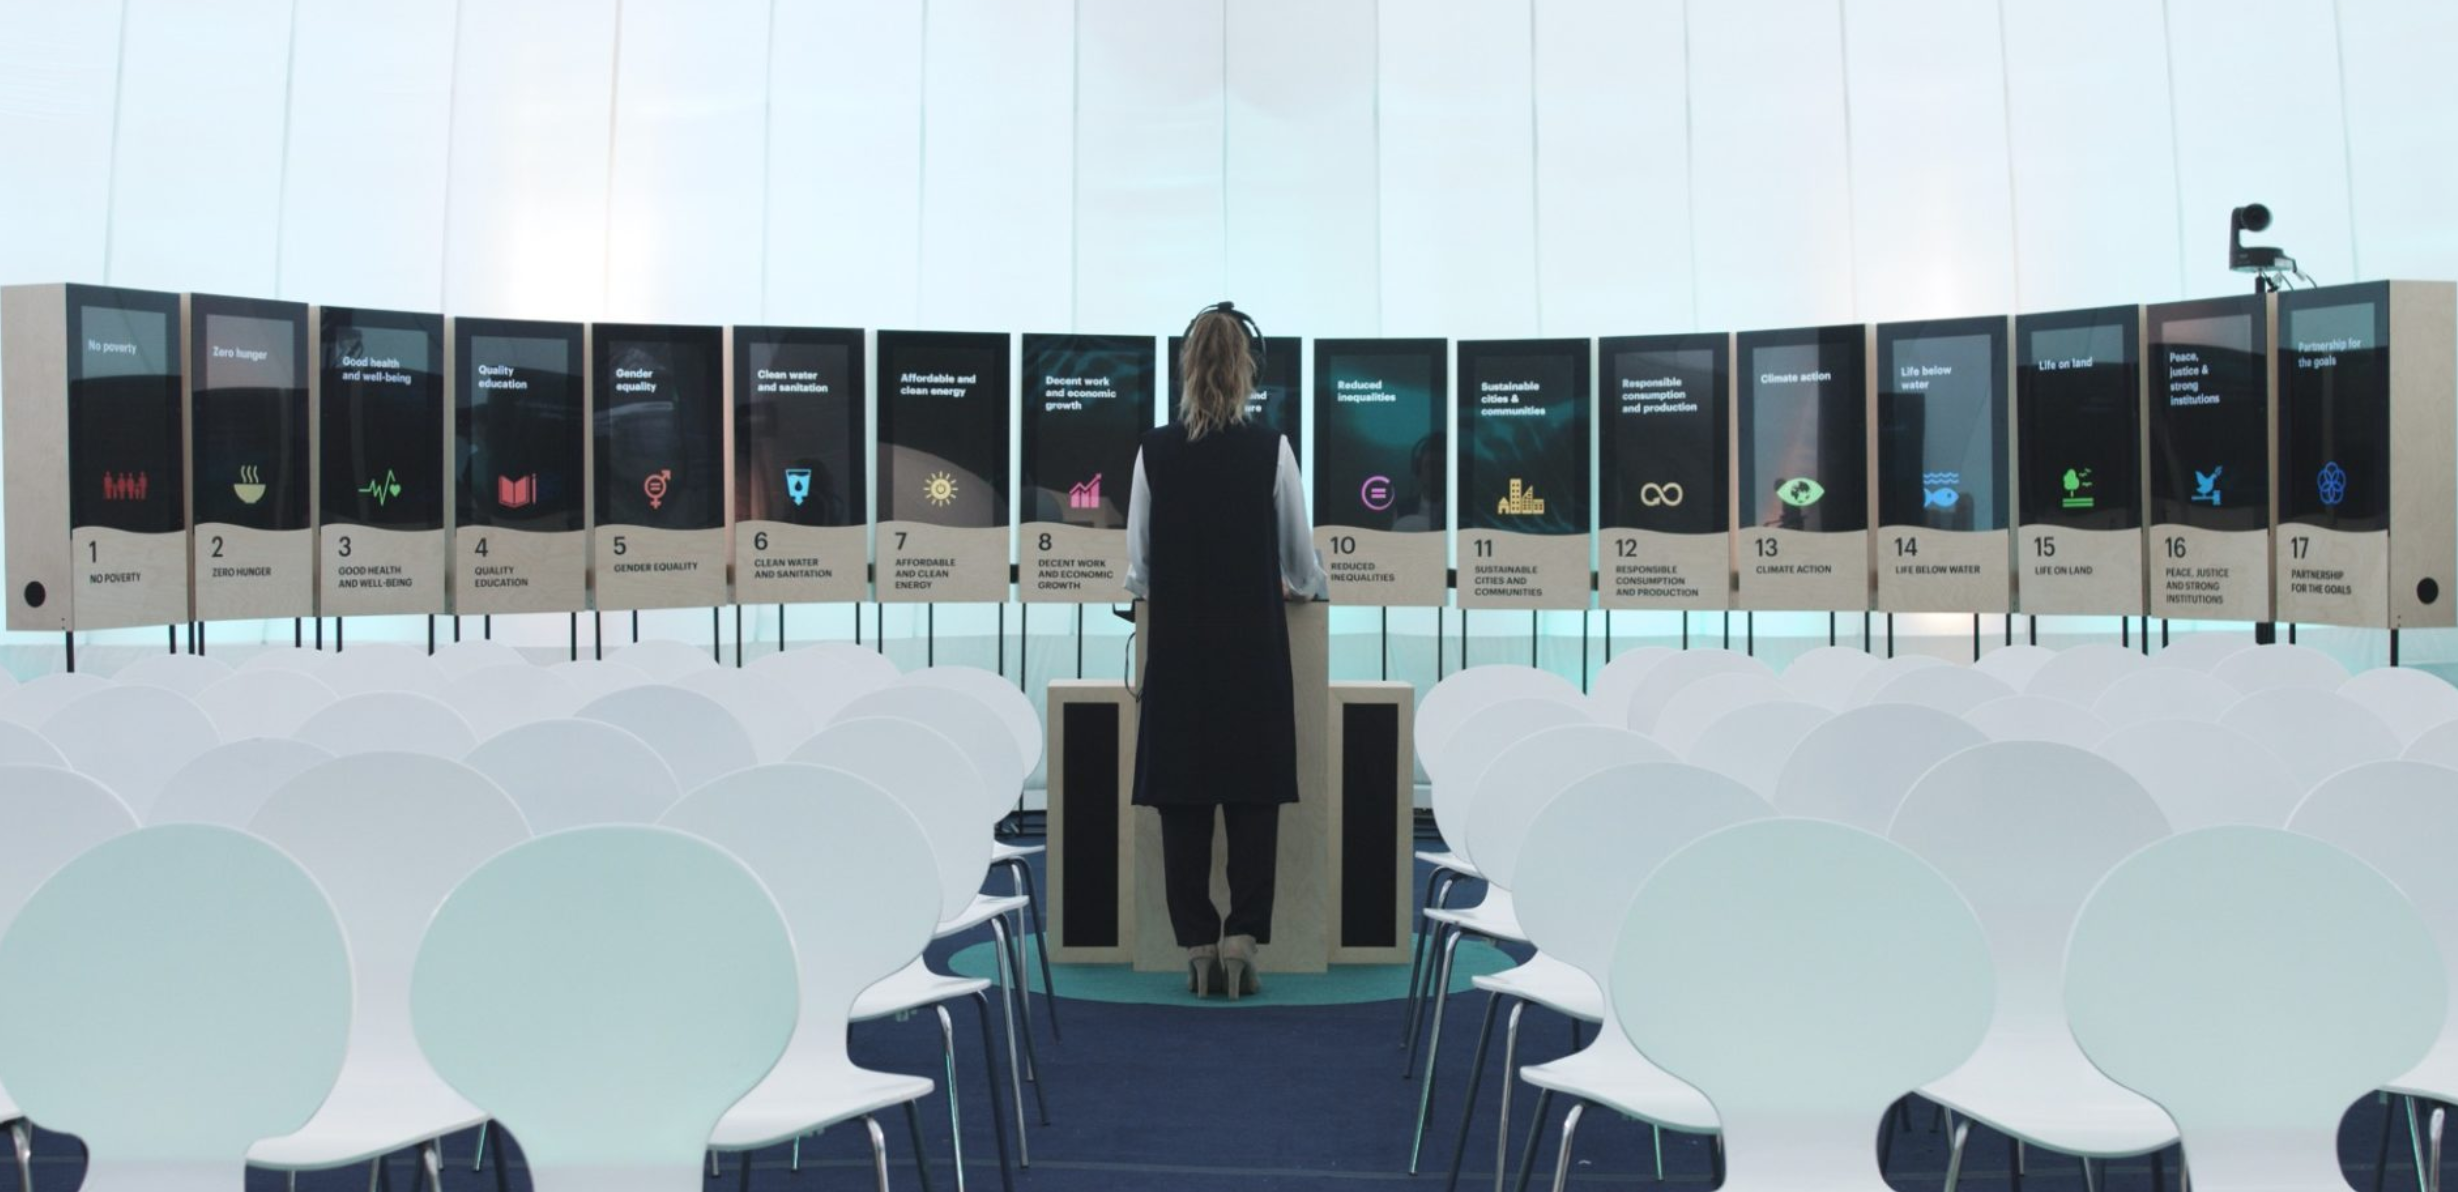
O.- In terms of iconic places, not necessarily institutional, what might be the one that has worked best for your visualisations? Any particularly outlandish places?
A.- There are some unusual places that have worked surprisingly well, such as at the United Nations General Assembly, in the Hall of the building in New York, reflecting on the need to collect data on education, health and progress of children in developing countries.
If you don’t collect information on how many children go to school or you don’t know how many children die because they don’t have access to clean water, then you can’t correct that problem, because it doesn’t exist. “Tell me what you count numerically and I will tell you what matters to you” is an expression that gives me a lot of information.
On the space where we have had a more symbolic intervention, there is a church in Jerusalem where we asked if the Virgin Mary could be considered the first influencer. Elaborating the language through a nod to beliefs is very powerful to generate these info-experiences that, on the other hand, we find throughout history in cathedrals, pyramids and other spaces where the important thing was to tell a story in a spectacular way. Nowadays, commercial brands have copied some of these messages, when even in places of worship they talked about storytelling as a tool for preserving social cohesion.
The places have changed, but we still have the need to preserve these stories, and now we have much more data to delve into the importance of maintaining this social cohesion with its values.
O.- I understand that all your interventions are based on your main claim: Fighting indifference through data. How did you arrive at this slogan?
A.- Most organisations often define themselves by what they are or what they do. And we decided to define ourselves by what we wanted to change. Our raison d’être is what we understand to be a problem in the world, although for many it is a great opportunity: human indifference and stupidity.
First, because human beings can manage not to be stupid. And second, because indifference begins when we lose our emotional connection to things. Data is a tool that leads to that connection and although we have always been recognised as a team that works a lot with data, it is our worst enemy: where you put the data, the process of indifference begins, unless you think about how you are using it and how you are telling it, and that is our main job. That’s our main job: how do we treat information so that it doesn’t turn the viewer into what you don’t want? A person who is indifferent to his or her social reality.
O.- In this fight against indifference through data, could you give three verbs that correspond to the type of action that you carry out?
A.- I like to Explore, Surprise and Empathise.
Something I really like is to generate vertigo: that our tales and stories generate vertigo with that immeasurable sensation of the information as an unfathomable story
O.- I get the impression that your actions share a lot of the pleasures of working with the raw material of data. How do you see the idea of sharing that obsession and pleasure with data so that a culture can be created around it?
A.- Something I really like is to generate vertigo: that our stories and histories generate vertigo with that immeasurable sensation of information as an unfathomable story. We seek to activate a multidisciplinary team that works to generate this vertigo from many different perspectives so that the spectator suddenly discovers that everything makes sense in a way that hadn’t occurred to him or her before. That when you see it you have this vertigo of curiosity, of creativity, that “wow”. I’m interested in creativity from the perspective of how to make a group of people understand something that is complex.
O.- In your internal glossary, what kind of effects or filters do you apply to the projects you are interested in?
A.- The frame effect is a very relevant one: if I explain a piece of information by giving you one piece of information or another, you are going to think something completely different. Imagine I tell you: “take this medicine that will cure you with a 99% probability” or “take this medicine that will not cure you with a 1% probability”. Although the probability may look different to you, it is actually the same. How we display data matters because our brain does not work cognitively in a high percentage of its time in a rational way but in an emotional way. Activating the rational system expends a lot of energy and the brain tries to preserve it.
This “frame effect” would be one of the main ones. Another one is when we are more condescending to ourselves than to others and do not judge ourselves so badly. We used it on one occasion to raise awareness about the proper use of water resources, through triangulation. Instead of asking the person directly, we ask about a person close to us and in this way we triangulate in the use of information, and so we are not judging. It is not a judgemental dialogue, but one in which a different kind of game is played and the information tends to get a richer engagement.
O.- Great. Do you think a lot of politicians use these effects as well?
A.- Yes, that’s very well proven. Daniel Kahneman (psychologist and economist specialising in decision making and the psychology of judgement and uncertainty, being especially known for his work in collaboration with Amos Tversky on prospect theory and cognitive biases) was awarded a Nobel Prize in Economics for his studies and they are known to be used in politics.
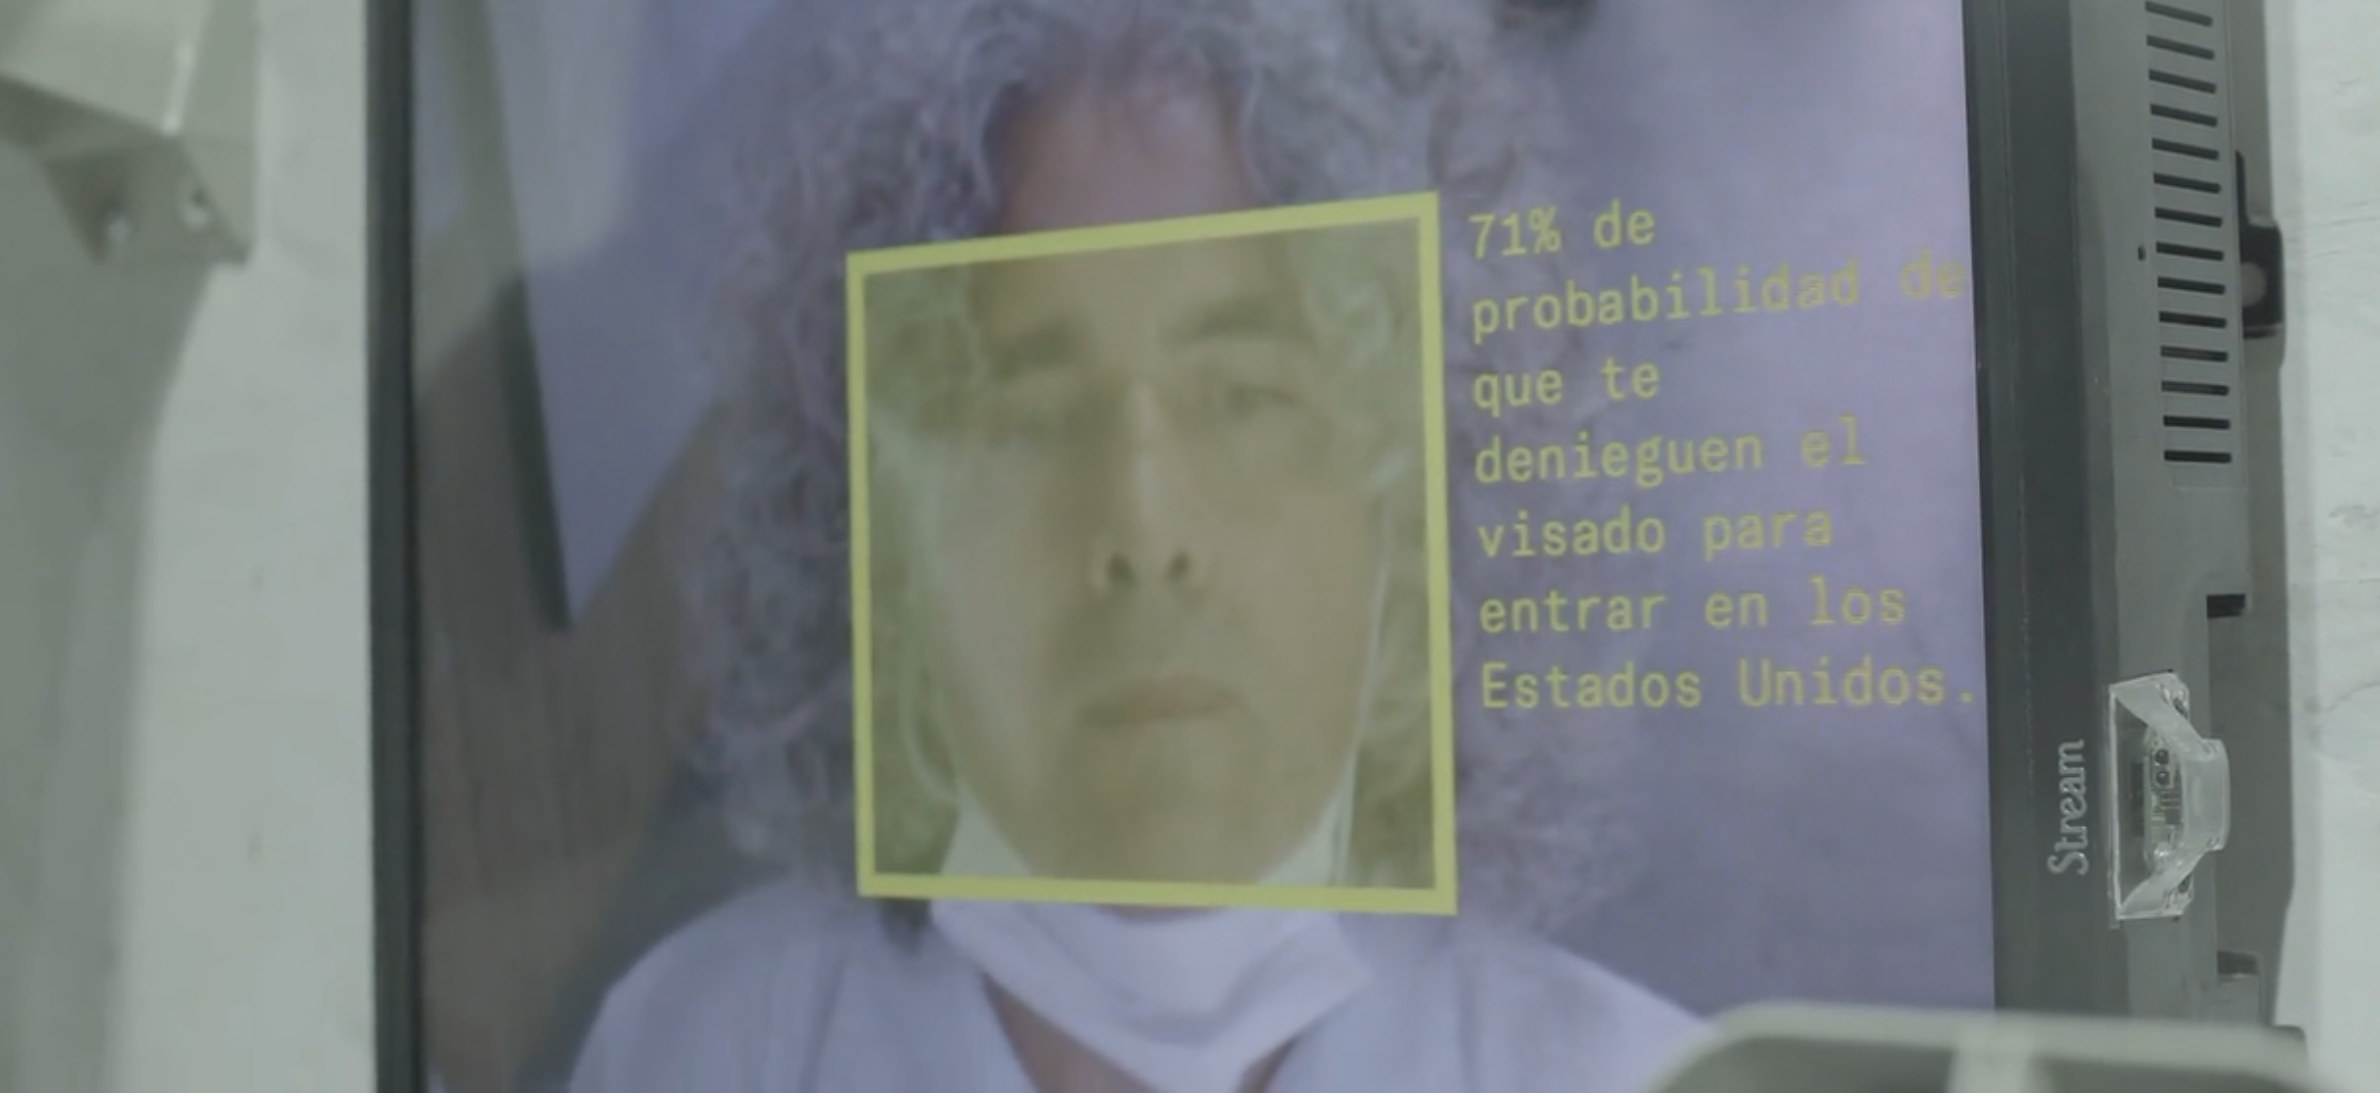
O.- Earlier we discussed how sometimes data does not reveal the privilege of some parties involved. With this in mind, I would like to address the project “The Privilege of Choice” that you have worked on together with Oxfam. According to the information available on domesticstreamers.com/projects/the-privilege-of-choice/, this project uses an interactive installation to raise awareness of inequalities and privilege. Could you elaborate on how this tool combines data and visual experiences to communicate disparities in access to opportunities and how it has impacted on awareness and understanding of inequalities and privilege in different settings?
A.- Oxfam had always had an inequality narrative, so we had a challenge, which was not to numerify poverty. Telling poverty is not the same as telling the story of poverty. It’s not the same to say how many poor people there are as it is to tell a story about poverty. You probably empathise much more with the latter than the former.
People don't listen to a narrative that makes them feel bad, but if you articulate a narrative in which you understand that you are losing privileges... then you are going to start to listen
People don’t listen to a narrative that makes them feel bad, but instead if you articulate a narrative in which you understand that you are losing privilege… then you are going to start listening. And I say to you, “this affects you”. I’m not going to talk to you about people living in poverty who have nothing to do with you in principle. No. I’m going to tell you that poverty starts from the most privileged and then it starts to subtract.
We use the “Loss Aversion” effect to design an interactive experience that quantifies the loss of privilege. In this approach, people react differently when they win or lose, even though the outcome is the same, because humans are biologically hardwired to be aversive to the loss effect. We created a questionnaire that assesses how privileges are lost according to factors such as gender, rural environment and education at home. In the end, the experience shows how these uncontrollable factors can lead a person to be below the poverty line, generating reflections on the risk of poverty without blaming or pointing fingers.
O.- Very revealing indeed. In relation to data visualisation before the technological age, I would like to mention the work of W.E.B. Du Bois, who created one of the most striking examples of data visualisation 118 years ago, just 37 years after the abolition of slavery in the United States. His visualisations reflected the living conditions of the African-American community in the 20th century, and were created in a context of urgency where communicating was essential. Given the sheer volume of data and the technologies available today, how do you address in your work the idea of an urgent cause that requires quick solutions and specific tools to communicate effectively?
A.- First, I believe that the perception of urgency is related to the individual’s experience and situation. If someone is facing a shortage of basic resources, they may find it difficult to care about long-term issues such as climate change. Our work, to some extent, targets audiences with certain privileges. Those with greater needs around the world may find it difficult to understand and address long-term issues in a rational way.
Experts have been warning about climate change for years, but the global mind shift occurred when an influential religious leader acknowledged that global warming is the result of human action and not divine will. This demonstrates that emotional, rather than rational, responses can more quickly drive a sense of urgency and action.
Therefore, any work we do to highlight the need for action to preserve the planet as an environment fit for human life must be approached from a moral and emotional perspective, rather than being limited to a purely rational approach.
O.- In terms of narrative based on emotionally evocative data visualisations, the visualisations created by the W.E.B. Du Bois team have a strong emotional and aesthetic charge reminiscent of works by artists such as Mondrian and Kandinsky. Do you identify with this tradition of visual representation, where diverse cultural forms are used to encourage reflection on strengthening social cohesion and re-evaluating our connection to others?
A.- It’s very difficult for me to speak from art because I’m a psychologist and I respect these perspectives a lot. But we do draw from many traditions that have to do with storytelling, whether they are cinematic or artistic resources. I could mention an exhibition in which we talked about the digital divide, exhibiting classic works, with data such as the Rosetta Stone, where we showed how every day “100,000 million” messages are sent around the world… All of these are palettes that we have used. Inspiration that can be more cinematographic or domestic, so to speak, as we don’t have a very marked aesthetic line. At the end of the day, what interests us are the questions, not so much whether something is aesthetically defended. If we believe that in a given context we have to adapt aesthetically to an audience, then we delegate it to someone who knows the context much better.
O.- I relate what you say to a subject that interests us a lot at Platoniq, which is participatory processes. Specifically, the citizens’ assemblies that are normally called by public administrations to deal with an issue that is very difficult to deal with politically, due to the polarisation of the parties. The Climate Assembly in Spain was very formal and standard, leaving little room for imagination or interpretation of the data. Most citizens’ assemblies start with a closed question, contextualised by interventions from experts who try to vulgarise very complex dossiers with a lot of data and with language that in the end is very technical for citizens. Here I believe that both Fundación Platoniq and Domestic Data Streamer have much to say and much to do to achieve a more intuitive understanding. For an optimal self and individual digestion of complex issues, what language or where would you start?
A.- I imagine it is closed groups that deliberate, is that right?
O.- They are groups made up of citizens chosen by civic lottery, experts, and observers that guarantee the representation of all strata of society. But this distribution does not normally create empathy, but rather the citizen is confronted like a politician with a dossier presented by an expert and has to start a dialogue and make recommendations, which is something very complex.
A.- By nature, decisions that go to the root require empowerment, which is difficult and expensive. The challenge is for citizens to have a minimum level of empowerment in relation to the life that awaits them. I imagine that if these panels are held, where the “learning journey” is discussed, a theme must first be addressed, how this information is presented and what emotions are generated by each of these points. I think it is necessary to present information that challenges you or the group you represent and to understand where you are speaking from.
